Stata provides different graphic commands for different types of data. This Stata tutorial explains how to use the program’s graph commands for data visualization and covers histograms box plots density plots bar charts pie charts scatter plots line plots bubble plots and best-fit lines. We show you how to use Stata to draw graphs for a single continuous variable a single categorical variable two continuous variables two categorical variables and one continuous variable and one categorical variable.We explore the Stata graph options used to customize markers lines axes labels titles and legends. The course demonstrates how to modify various graphs’ symbols colors patterns and text to make them more attractive and informative which can improve the quality of presentations and publications. We then teach you how to overlay multiple plots in a graph and combine multiple graphs into a single version.Finally the course explains how to save and export graphs to different formats. Graphs and data visualization effectively display variables and their relationships. Graphs are widely used in business statistical analysis and empirical research in every academic field. Learning how to use Staka enhances your professional portfolio as data science plays a key role in many industries. Sign up for this Staka tutorial to improve your ability to analyze visualize and present data.
Introductory Stata 2023: Graphics and Data Visualization

Introductory Stata 2023: Graphics and Data Visualization
Sold by:
Similar Products
Sponsored
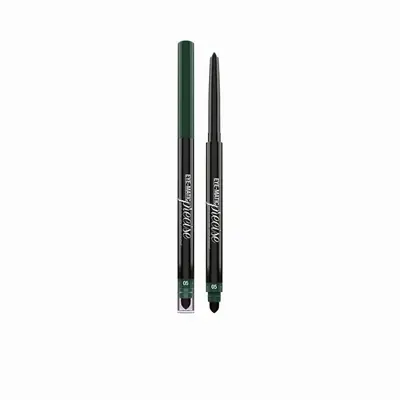
Bellaoggi Eye Matic Precise Waterproof Long Lasting Eye Pencil 5 - Wild Green$6.00List: $7.00




Sponsored
Garvee Outdoor Black & Brown 8x10 Large Rug, Waterproof Plastic Straw Rug Reversible Geometric Design Foldable Portable with Stakes & Bag for Patio Camping PicnicPPG_33EKD8GJ
$59.99Garvee Innovation Inc
Compare prices from 2 stores

Sponsored
Armaf ENCHANTING SCIRING FOR EXCELLENT 1.2 ML 01 dark brown$15.00List: $19.00